Multiple histogram
The multiple histogram element displays the evolution of multiple values on the time axis.
Configure
Warning
Ensure the graphics library is included and initialised according to the configuration procedure.
Multiple myMultiple(&myGraphics);
The constructor Multiple() creates a multiple histogram and sets the link to the graphics myGraphics.
1 2 3 4 5 6 7 | |
The required parameters are
-
The first line sets the x-y coordinates and the width and height of the graphic;
-
The second line sets the name, minimum, maximum, unit and colour of the first series of values.
The optional parameters are
-
The third line sets the name, minimum, maximum, unit and colour of the second series of values;
-
The fourth line sets the name, minimum, maximum, unit and colour of the optional third series of values;
-
The fifth line sets the name, minimum, maximum, unit and colour of the optional fourth series of values;
-
The sixth line sets the period between two measures in ms, default is
0for none; -
The seventh line sets the marks on the x-axis every number of measures and splits the y-axis into a given number of sections;
-
The eighth line sets the continuity, with the same options as for the Histogram.
Note
For monochrome and colour e-paper screens, ensure the selected colours are supported.
Then,
myMultiple.setStep(1);
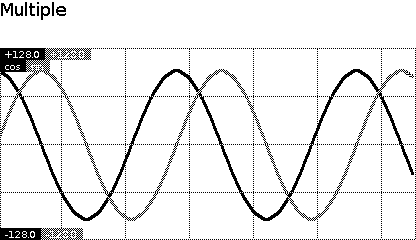
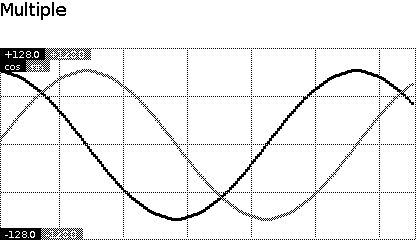
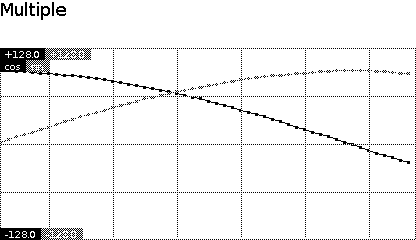
setStep() defines the number of pixels between two values and is optional. Default is 1: the new value is shown close to the previous one.
Below, the same curve with different values of step.

Use
1 2 3 4 | |
draw() sends the new values of the corresponding series.
-
Only the first line with value
valueAis required. -
All the other lines with values
valueB,valueCandvalueDare optional.
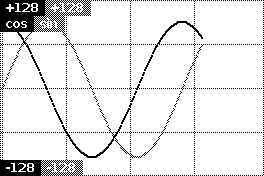
Example
This is the core of the code from example Graphics_Multiple.ino. The example provided targets a monochrome panel.
void displayMultiple()
{
    myScreen.setOrientation(myOrientation);
    myScreen.clear();

    uint16_t x, y, dx, dy;

    x = myScreen.screenSizeX();
    y = myScreen.screenSizeY();
    dx = x / 5;
    dy = y / 5;

    Multiple myMultiple(&myGraphics);
    myMultiple.dDefine(0, dy, x, y - dy,
                       "cos", -128, 128, 1, myColours.black, // 1st series: name, min, max, colour
                       "sin", -128, 128, 1, myColours.grey, // 2nd series: name, min, max, colour
                       "", 0, 0, 0, 0, // 3rd series: name, min, max, colour
                       "", 0, 0, 0, 0, // 4th series: name, min, max, colour
                       64, 4, // marksX sectionsY
                       true); // continuous

    myScreen.selectFont(fontMedium);
    myScreen.gText(0, 0, "Multiple");

    int32_t valueA = 0;
    int32_t valueB = 0;

    for (uint16_t count = 255; count > 0; count--)
    {
        valueA = cos32x100(count * 200);
        valueB = sin32x100(count * 200);

        myMultiple.draw(valueA, valueB);
        myScreen.flush();
    }
}