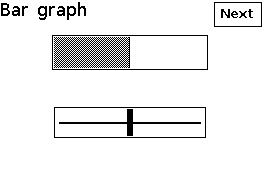
Bar-graph
The bar-graph is an output element and displays a value as a chart, with the greyed area proportional to the value.

Configure
Warning
Ensure the GUI library is included and initialised according to the configuration procedure.
BarGraph myBarGraph(&myGUI);
The constructor BarGraph() creates a bar-graph and sets the link to the GUI myGUI.
1 2 | |
dDefine() defines the bar-graph with vector coordinates.
The required parameters are
-
The first line specifies the vector coordinates: top-left coordinates x-y then width and height in pixels;
-
The second line defines the range of the values, with minimum and maximum, both as signed 32-bit integers.
By default, the bar-graph is oriented horizontally and is not activated.
Then,
myBarGraph.setOption(optionHorizontal);
setOption() defines the orientation of the bar-graph:
-
optionHorizontalorfalsefor horizontal orientation; -
optionVerticalortruefor vertical orientation.
Note
Use literals instead of values for upward compatibility.
Default is false for horizontal orientation.
setState() is not implemented.
Use
myBarGraph.draw(value);
draw() displays the bar-graph with the new signed 32-bit integer value.
The element checks the value is within the defined range, and replaces it with the minimal value if is inferior or the maximal value if it is superior.
Example
This is the core of the code from example GUI_BarGraph.ino.
void displayBarGraph()
{
    myScreen.setOrientation(myOrientation);
    uint16_t x, y, dx, dy;
    int32_t value = 128;

    x = myScreen.screenSizeX();
    y = myScreen.screenSizeY();
    dx = x / 5;
    dy = y / 5;

    myGUI.delegate(false);

    myGUI. myGUI. myGUI. myGUI.dLabel(0, 0, x, dy, "Bar graph", myColours.black, myColours.white, -1, 1, fontLarge);

    BarGraph myBarGraph(&myGUI);
    myBarGraph.dDefine(dx, dy, dx * 3, dy, 0, 255);
    myBarGraph.setOption(optionHorizontal);
    myBarGraph.draw(value);

    Cursor myCursor(&myGUI);
    myCursor.dDefine(dx, dy * 3, dx * 3, dy, 0, 255);
    myCursor.setState(true);
    myCursor.setValue(value);
    myCursor.draw();

    drawNext();
    myScreen.flushFast();

    myGUI.delegate(true);
    while (!checkNext())
    {
        if (myCursor.check(checkInstant))
        {
            value = myCursor.getValue();
            myBarGraph.draw(value);
        }
        hV_HAL_delayMilliseconds(10);
    }
}